Arnulf Hader, Senior Researcher at the Institute of Shipping Economics and Logistics (ISL) in Bremen, gives insights into the state of the cruise industry
Introduction
The ISL has not only released a new publication on the world cruise fleets recently, it is[ds_preview] preparing a list of cruise vessels since more than 30 years. The definition of this ISL fleet has always been the same: All seagoing vessels of 1,000 gt and over, with 100 or more beds year-round or temporarily engaged in cruising.
Looking back over three decades, it can now be stated that most of the vessels are purpose-built cruise vessels today – deployed all year-round in different regions. In the 1980s there was a mixture of modern cruise vessels, reconstructed liners, liners seasonally changing from liner to cruise services and back, ferries temporarily used for cruises or elderly passenger vessels in summer service and winter lay-up. Thus, not only the number of ships has grown but also the use to capacity.
Latest basic fleet data
By mid-2013, according to ISL data, the ocean cruise fleet comprised 295 vessels holding 446,800 beds, the largest capacity ever for pleasure cruises. The figure of beds is based on double occupancy disregarding a third or fourth bed in some cabins. For comparing capacity to demand it makes more sense to show the capacity in lower beds only. This is proved by major operators often reporting an average occupancy of slightly above 100%.
Under these conditions the average capacity of the 295 vessels is 1,515 passengers. The total tonnage is 17,601,672 gt resulting in an average size of 59,668 gt per ship. The effective minima are currently 100 beds and 2,191 gt and the maxima are 5,408 beds and 225,282 gt. The average age of the vessels is 17.3 years. Regarding the increasing newbuilding activity in the last decades this may be astonishing high, but cruise vessels easily reach an age of 40 years and a few are nearing their 60 th launching day. While in 1983 the average gross tonnage of the fleet was 14,986 gt, it is exactly four times the size 30 years later. The ships on order indicate that this growth will continue.
Registry
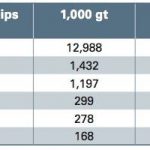
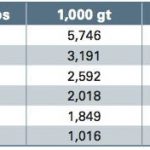
Most of the cruise vessels are operated under a flag of convenience (FoC). As a result only six flags have accumulated more than 1mill. gt each while under further 21 flags only one to six vessels are registered (Tab. 1). The ranking is lead by four FoCs which don’t need much explanation today. More interesting are the national flags: Italy and the Netherlands offer commercial conditions that are attractive enough that the US-based Carnival Group has registered the fleet of Holland America Cruises in the Netherlands and the fleet of the Costa and Aida brands in Italy.
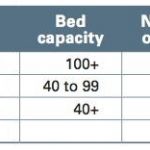
More interesting than the ranking of flags is the distribution according to countries of control. This is often not easy and other allotments would be possible, e.g. in the case of the Royal Caribbean Group which has Norwegian roots and is based in the USA today, or in the case of MSC Cruises with headquarters in Geneva and activities in Italy. Norwegian Cruise Line (NCL) is 50:50 owned by Malaysian and US interests and TUI Cruises 50:50 by German and US partners.
Under these conditions the ranking in Tab. 2 could be modified, but one fact is undisputable: US interests are overwhelming. Beyond them only the Malaysian Genting Group, MSC and the TUI Group are worth mentioning, others have market shares far below 1%.
Number and capacities
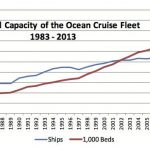
During 30 years under review the number of cruise ships has more than doubled from 139 to 295. It was stagnant during the 1980s and made a jump in the 1990s when a lot of small new cruise ships entered the market. Between 1990 and 2011 the number of ships grew nearly every year, and now the fleet is stagnating just below 300 because the number of new ship entries is balanced by the number of withdrawals. It is expected that the number of ships will not surpass the 300 mark in the next few years (Graph 1).
The fat line indicates that the average capacity of the vessels has always been rising. In 2002 the number of lower beds per ship was more than 1,000 for the first time. In 1986, when ISL started to count the beds, the average number was 638, and in 2013 it is 1,515. Looking at the capacities of 3,000 to 5,400 in the current newbuilding orders, it will continue to increase definitely. In absolute figures the number of beds stood at 95,000 in 1986 and reached 446,800 in June 2013 when all new ships expected for that year had been delivered.
The annual increase of capacity is not as smooth as the long curves may suggest. The terror attacks of New York in 2001 had an immediate effect on flight travel by US citizens and on ordering of new cruise ships which was, however, only felt in 2005 after the long planning and construction period of such complex vessels. The financial crisis of 2008 had an influence since 2012. Graph 2 shows the net additions of beds to the fleet between 1987 and 2013. For 2003 to 2013 the deletions from the fleet are also shown. For 2014 to 2016 only the planned additions in new vessels are shown; the net increase will be lower.
Order book
The order book shows now the delivery program for 2014 and 2015 and probably most of the vessels to come in 2016. The Chinese Xiamen Group has announced its first newbuilding for 2018. The average number of beds coming on the market during the next years will be about 20,000 p.a. Every year about five vessels > 2,000 beds and one to three smaller ships will be delivered.
The big operators are well represented by Carnival, Royal Caribbean and Norwegian Cruise Line in the order book; only MSC Cruises will stretch four existing vessels before ordering new ships again. In the luxury segment the newcomer Viking Ocean Cruises, a sister company to Viking River Cruises, has already ordered four ships with nearly 1,000 beds each.
Operators
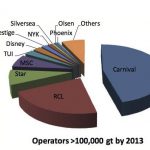
The owner/operator structure is another aspect of the fleet which has changed dramatically. There is no need to explain the dominating role of the Miami-based Carnival Corporation comprising 46 % of the tonnage, one third of the ships and 46.5 % of the beds of the ocean fleet. Like the second ranked Royal Caribbean Group, which is also based in Miami, they grew by acquisition of competitors and newbuilding activities (Graph 3).
It is nearly impossible to include all forms of cooperation between the groups which exists in spite of fierce competition. As an example, Royal Caribbean has a 50:50 joint venture with TUI called TUI Cruises. NCL, one of the pioneers of Caribbean cruising, had been acquired by the Malaysian Genting Group, owner of Star Cruises. By 2008 the private equity group Apollo Management bought 50% of the NCL shares. Apollo is also owner of the Prestige Cruise Holdings with two luxury brands.
The youngest gross tonnage millionaire is Italian MSC Cruises. It is a sister company of the container operator Mediterranean Shipping Company. The cruise company goes back to Lauro Lines but within the last twelve years a fleet of twelve new ships was built up and the last elderly ship was sold recently.
German TUI Group has the fifth rank now, if TUI Cruises is fully allotted to TUI. The operator will receive two more ships in 2014/15, but its luxury brand Hapag-Lloyd will give back »Columbus 2« to Oceania Cruises in spring 2014. TUI is also engaged in expedition cruises with further ships besides its own »Bremen« and »Hanseatic«. The fleet of the British brand Thomson Cruises is also not fully owned but partly operated in cooperation with the Louis Group of Cyprus.
Japanese N.Y.K. Group owns three cruise ships, one for the national market and two for the internationally positioned brand Crystal Cruises. Silversea Cruises has built up a luxury brand based on new vessels with an expedition arm relying on used tonnage. Two more companies have fleets of owned, secondhand acquired vessels. But it will be more and more difficult for them to find suitable tonnage: UK-based Fred. Olsen Cruise Lines has sold the oldest ship and is sometimes supposed to be interested in new tonnage. Phoenix Reisen of Bonn had already other ships under charter but in the current fleet of three one has financial interests.
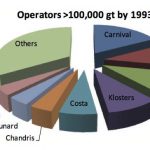
Graphs 3 and 4 show the operators with more than 100,000 gt in their fleets by 2013 and 20 years before. The dwindling share of »others« is exemplifies the concentration process.
Destinations
Like the cruise fleet, the number of destinations has also become larger than ever. Besides the traditional destinations for European tourists (e.g. the Med and Northern Europe/Polar Sea) as well as the Bahamas/Caribbean Sea for American travellers, the Baltic Sea, Alaska, Middle America etc. are also important regions for already some decades.
Parallel to developing source markets like Brazil or Australia more distant regions are now regularly visited by cruise ships. The Emirates and Gulf states are among the latest destinations. Spectacular new cities and huge airports make them a good winter destination for ships cruising in northern regions during the summer. The political changes helped former Soviet ports to become more attractive, not only St. Petersburg but also in the Black Sea and in the Far East. Finally, China is arising as a new source market and an important destination. Since the government is fostering cruise tourism one should take into consideration that China could become the largest player in the industry some day.
The world still offers many small places which are not yet developed for cruise tourism, but the number of large regions is definitely limited. Many of them are far distant from the source markets and require long and expensive flights. For the mass market with typical seven-night cruises the number of destinations is rather small. Therefore, Americans still prefer Caribbean cruises, Europeans Mediterranean cruises and the Chinese will first visit (southeast) Asian countries before coming to Europe.
For the operators the most rewarding development is that their vessels have become destinations themselves. The ever larger ships offer more and more onboard attractions like a broad choice of restaurants and bars, shopping, entertainment, sports or wellness. The importance of shore excursions is decreasing. This development, together with new ships fitted for winter cruising by covered sun decks, helps to extend the seasons in regions with ugly winter weather. A new era will begin in 2015 when Aida Cruises will position its new »Aida Prima« year-round in Hamburg for weekly trips to Southampton, Le Havre, Zeebrugge and Amsterdam.
Markets
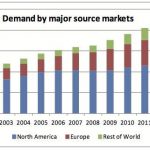
It is well known that North America is by far the largest source market since the start of modern cruising in the early 1970s. Many attractive destinations like the Caribbean Sea, Bahamas, Bermudas, Mexico or Alaska are not only arranged around the continent, they also include summer and winter destinations. Many flight connections made the access to the ports easy. At these early days, new operators like Carnival, Royal Caribbean, Klosters, Princess Cruises etc. built vessels specifically for this market, and the demand grew to nearly 12 mill. trips per year.
The traditional European brands, however, still operated ships built for liner services which were not fully suited for cruise duties. Outside the summer season in Northern Europe or after being on liner services they changed into the Mediterranean Sea in spring and autumn, but winter destinations were still far away. Not all elderly ships had been allowed to operate from US ports. Most of these companies didn’t survive the harsh competition – for some time also by Soviet ships – or were taken over by US competitors. Without some new brands like Aida or MSC Cruises the European market would not have made such a positive development as it did in the last ten years. Led by the British and German markets, Europe in total grew to 6.4 mill. cruise passengers (Graph 5).
The US market saw a setback after the damages to port cities and beaches by the hurricane Katrina because operators transferred more capacities to Europe. Now, while Southern Europe is still suffering under the financial and economic crisis and Caribbean destinations are rehabilitated, more ships are again positioned in US ports. This means a faster growth in the American source market and nearly stagnation in Europe.
In the longer term, however, Europe should generate more demand than North America, not only because of the larger population, but because Eastern Europe will catch up and also smaller West European countries are still underdeveloped in terms of cruising. They have neither own ships nor ones dedicated to regional peculiarities yet.
Finally, the Asian source market led by China has a good chance to overtake not only America but also Europe. The number of well-situated people is increasing very fast and they are open for new experiences including travelling by ship.
Author: Arnulf Hader
Institute of Shipping Economics and Logistics (ISL)
Maritime Economics and Transport, Bremen / Germany
Tel. +49 (0)421/2 20 96-14
hader@isl.org, www.isl.org
Arnulf Hader


